Know exactly when to reorder and how much.
From the export you already have.
Twenty-second shelf check
No file needed. Two numbers you already know.
A ballpark is fine. Nothing you type here leaves your browser.
“The formulas have been around for years. They just get skipped, because doing them by hand takes hours nobody on the floor actually has. So I built the tool I always wanted. What used to cost me a full day now takes minutes.”
Neil Leinen, CVPM. Multi-Site Director of Operations, 20+ years in practice.
Read the full story
StockSolve started with a frustration I couldn't quite let go of. As a CVPM and Director of Operations for multi-site hospitals, I spent years trying to find a better way to manage inventory: sitting through the lectures, working through the management playbooks, hoping someone would finally connect the dots.
If you've ever placed a panicked late-night order for something you could've sworn you just had, or quietly overbought for months just to feel safe and then watched that money sit on a shelf, you know how it wears on you and your team.
I built StockSolve because I was tired of watching good people carry that stress, and honestly tired of feeling it myself. It's the tool I wish I'd had on the clinic floor from the very start: something that quietly handles the hard part, so a little of that weight can finally lift.
See it work before you sign up.
Rather try it on your own numbers? Run your free audit.
Same export.
Numbers you can order from.
| Category | Total Sold | On Hand | Cost |
|---|---|---|---|
| --- PHARMACY --- | |||
| Carprofen Flavored Tab 75 mg | 540 | 353 | 0.26 |
| Maropitant Inj 10mg/mL(Cerenia) | 60 | -3 | 10.04 |
| Apoquel 16 mg | 500 | 420 | 0.00 |
| Subtotal 4,318.22 | |||
| Gabapentin 100 mg | 1,239 | 1,141 | 0.02 |
A category header, a subtotal row, a negative on-hand count and a cost that exported as zero. Nothing here tells you when to order.
| Item | Reorder at | Order qty | Class |
|---|---|---|---|
| Carprofen Flavored Tab 75 mg | 139 | 180 | B |
| Maropitant Inj 10mg/mL (Cerenia) | 25 | 20 | A |
| Apoquel 16 mg | 192 | 250 | A |
| Gabapentin 100 mg | 423 | 1000 | C |
Junk rows dropped, the negative count and the zero cost flagged for you to fix, and every item carries the two numbers that drive an order plus its ABC class.
Illustration using demo data.
How this compares to doing it by hand+
| Spreadsheet by hand | StockSolve | |
|---|---|---|
| Time for a full catalog | A full day, realistically split across several | Minutes, in one pass |
| The formulas | Built and re-checked by you | Applied to every item the same way |
| Pack sizes | Every small and large pack keyed in by hand, item by item | Matched automatically, you confirm the odd ones |
| Lumpy chronic meds | Work out which items are even lumpy, then pull each history one at a time | Flagged for you, with the history shown right there |
| Bad data | You find it when a number looks wrong | Surfaced before the math runs |
| Next month | Start over | Your decisions are saved and carried forward |
Read the full list, problem by problem, on the blog.
Built for a real pharmacy shelf.
Burst-selling chronic meds
Thyroid meds and other chronic scripts sell 60 or 90 at a time, then nothing for months, and they are the hardest items to stock by hand. StockSolve reads each item's own 12-month pattern, suggests a minimum shelf quantity in the amounts it actually sells in, and saves it so you never calculate it again.
Demo data. Suggested 165, from active months 60, 60, 90, 120, 165.
Clinical Pack-Size Routing
Orders are rounded to the distributor's real box, bottle and flat sizes, so every suggestion is one you can actually buy.
Smart Cloud Memory
Every ignore, pack size, cost, min-shelf target and note saves to your Master Key and applies itself next month.
Smart Phase-Out Mapping
Swap Rimadyl for carprofen and the sales history merges into the new item, so forecasts stay accurate.
See it work on your own data.
Run your free audit.
Free, no card, and your counts stay in your browser.
Three steps. About fifteen minutes the first time.
Export Your Reports
Pull three standard reports from AVImark, Cornerstone, ezyVet or any other PIMS. No API, no IT ticket.
- Monthly Sales History
- Current cost of goods sold (COGS)
- Total On-Hand Inventory
Run the Optimizer
Upload them. The engine applies the standard reorder-point and order-quantity math to every item and matches supplier pack sizes for you.
Use the numbers
Type the reorder points into your PIMS, print shelf tags, or let the Reorder Hub build each week's buy sheet from your counts.
reorder point =
(avg daily use × lead time)
+ safety stock
safety stock = Z × σmonthly × √(lead time ÷ 30.4)
Standard inventory math, applied per item across your whole catalog. Nothing invented, nothing hidden.
See it worked by handWhat you get with a subscription
Real screenshots. Click a module, step through its screens.
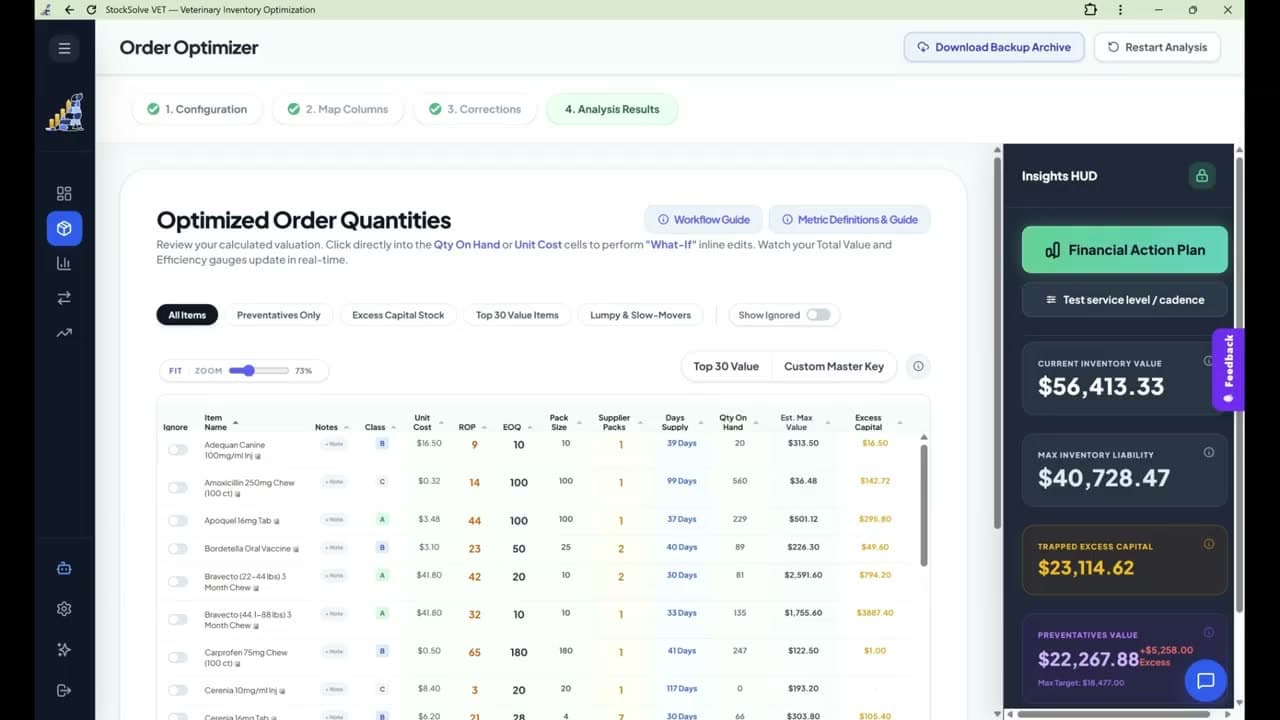
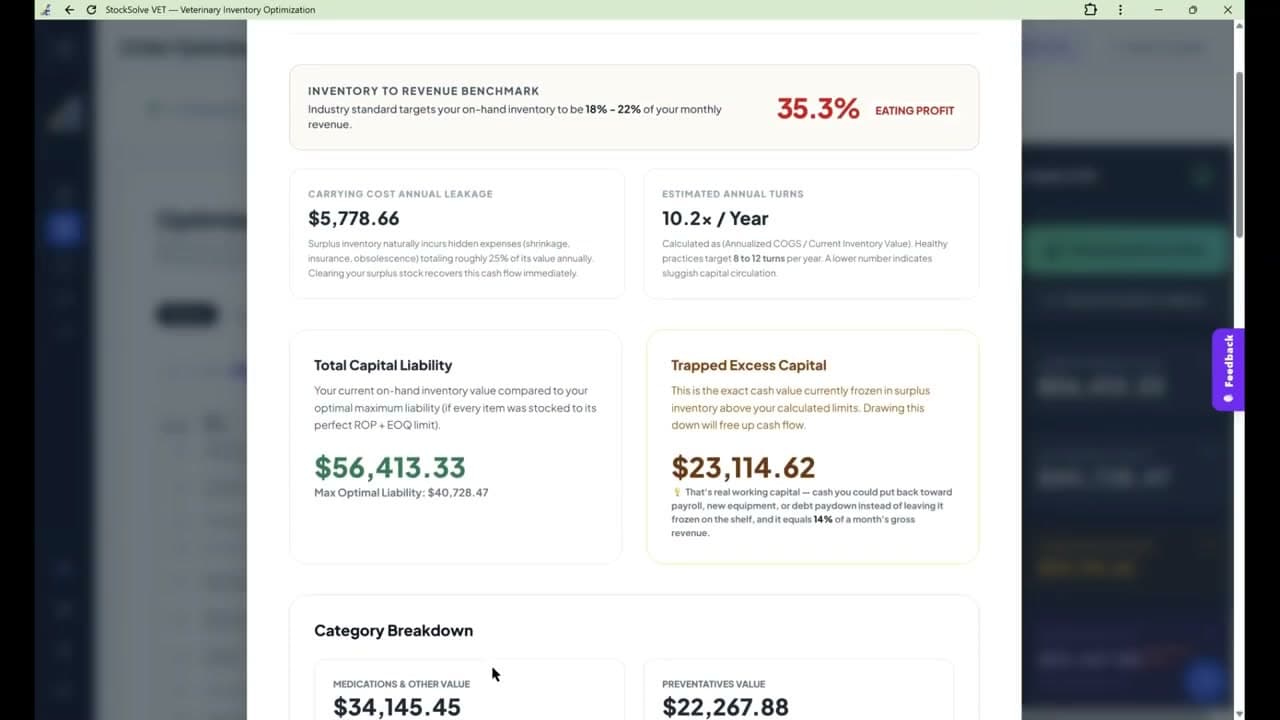
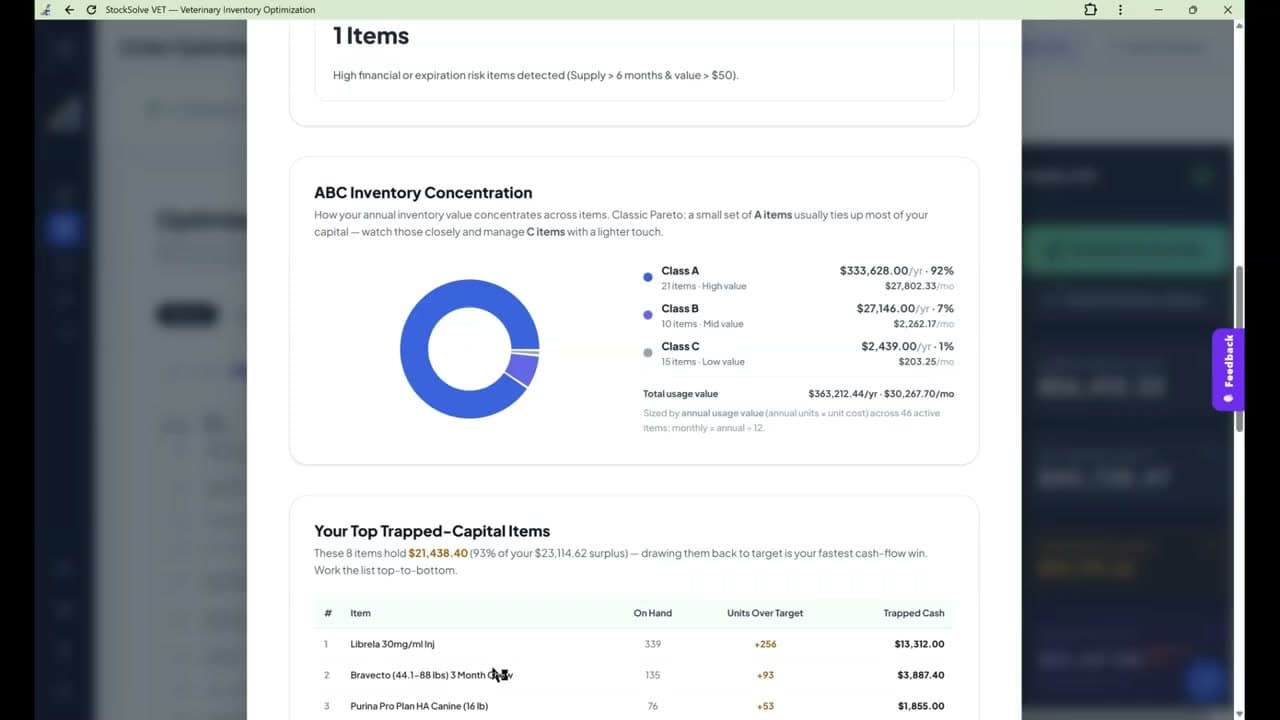
Every item scored in one grid: reorder point, order quantity, days of supply, and the live Insights HUD pricing what your shelf is really holding.
Pricing
$36 a month or $300 a year. Cancel anytime.
StockSolve Monthly
Month-to-month access to the full inventory algorithm. Cancel anytime.
- Unlimited Order Optimizer Reports
- Complete Total Valuation Reports
- Full Reorder Hub Access
- Financial Trends Hub (monthly snapshots, owner's one-pager)
- Standard Email Support
StockSolve Annual
Lock in your savings for the year and optimize your entire practice.
- Unlimited Order Optimizer Reports
- Complete Total Valuation Reports
- Full Reorder Hub Access
- Financial Trends Hub (monthly snapshots, owner's one-pager)
- Priority Support
More than one hospital? Hospitals 2 to 4 are 10% off, 5 or more are 25% off, and every location gets its own workspace and Master Key. Multi-site also unlocks the Transfer Hub, which moves surplus between your locations instead of buying it twice, with controlled substances held out by default. Add your hospitals
What the Trends Hub tracks+
- Streak & Cash Unlocked. Saving monthly builds a streak, and every dollar of trapped capital you recover banks into a Bronze to Diamond odometer that never moves backward. A bad month adds zero. It never subtracts.
- Coach's Corner. Insight cards that name your own numbers and put a dollar figure on the problem, like a quiet COGS creep running about $10k a year, then link straight to the screen that fixes it. They stay silent when things are healthy.
- Healthy-Zone Meters. Efficiency tracked against the 18 to 22% band and true inventory turnover against 8 to 12 times a year, with honest pace estimates so you know how far off you really are.
- Reports Owners & Accountants Love. The printable Owner's One-Pager puts this month's wins on a single page, plus a one-click accountant-ready year export for year-end COGS reconciliation.
Frequently Asked Questions
I am new to managing inventory. Where do I start?+
You do not need a spreadsheet background. There are really only two decisions: when to reorder something, and how much to bring in. Our beginner's guide walks through both from scratch, with a worked example and the three habits worth starting this week. When you want the data out of your system, the PIMS export guides cover the exact reports to pull. If you would rather start with something tiny today, log what you run out of in the free stockout log.
What does StockSolve actually do that my spreadsheet can't?+
The formulas are public and your spreadsheet can compute them. What it can't do is the part that eats the day: filling in supplier pack sizes for a thousand items, rounding order quantities to real bottles without overstocking you, reading a year of transactions on every burst-selling chronic med, and remembering all of it next month. We wrote up the whole list, problem by problem, in Why StockSolve? Each row is a specific headache next to the shipped fix, so you can judge in two minutes whether these are your headaches.
What if I do not have 12 months of sales history?+
Start with what you have. The engine averages however many months you upload and annualizes them, so three months still gives you reorder points you can act on today. A shorter window mainly costs you seasonality, which needs a full year to show up at all, and it sharpens every month you add.
Is my financial data stored on your servers?+
No. Your on-hand counts and item-level figures stay in your browser. The only things saved to your account are your settings (pack sizes, item names, the corrections you make, so you never redo them) and, if you use the Trends Hub, a monthly summary of totals with no item-level counts. You can download a ZIP of all of it any time.
Does it connect to my PIMS?+
No, and that is by design. Nothing is installed and nothing touches your PIMS: you export three standard reports (sales, cost, on hand) and upload them. Afterwards, either type the reorder points into your PIMS alerts, or load your Master Key into the Reorder Hub and it builds each week's buy sheet from your counts for you to place with your supplier.
Does this track my syringes and white goods?+
No. Visual bin systems and red tags are perfectly fine for white goods. StockSolve is engineered specifically to optimize high-value, billed, trackable items within your PIMS (like your pharmacy, retail, prescription diets, in-house lab supplies, and high-value injectables). Basically, if you buy it from a supplier and bill it through your PIMS, we can optimize it.
My PIMS categories are a mess. Can I still use this?+
Yes. The free Setup Assistant sorts your catalog into trackable inventory, service-line products, services and white goods in about 15 minutes, in your browser. Try it free or read how the categories work.
Find out what your shelves
are actually holding.
Upload one export. Free, no credit card, your figures stay in your browser.